Viewing Insights
After your teams have enabled automated effort tracking and performed some work, the reporting dashboard starts to populate with insights about where they spend their time.
If you don’t see the data you’re expecting:
Verify that you have the correct permissions with your Jira Administrator.
Verify that your team has integrated with the correct apps.
Revisit the charts in a day or two to see if worklogs need to be generated for your team.
We recommend reviewing our Best Practices to see if there’s a process change that can help.
View Capacity Insights Charts
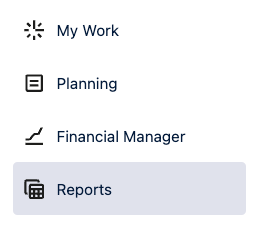
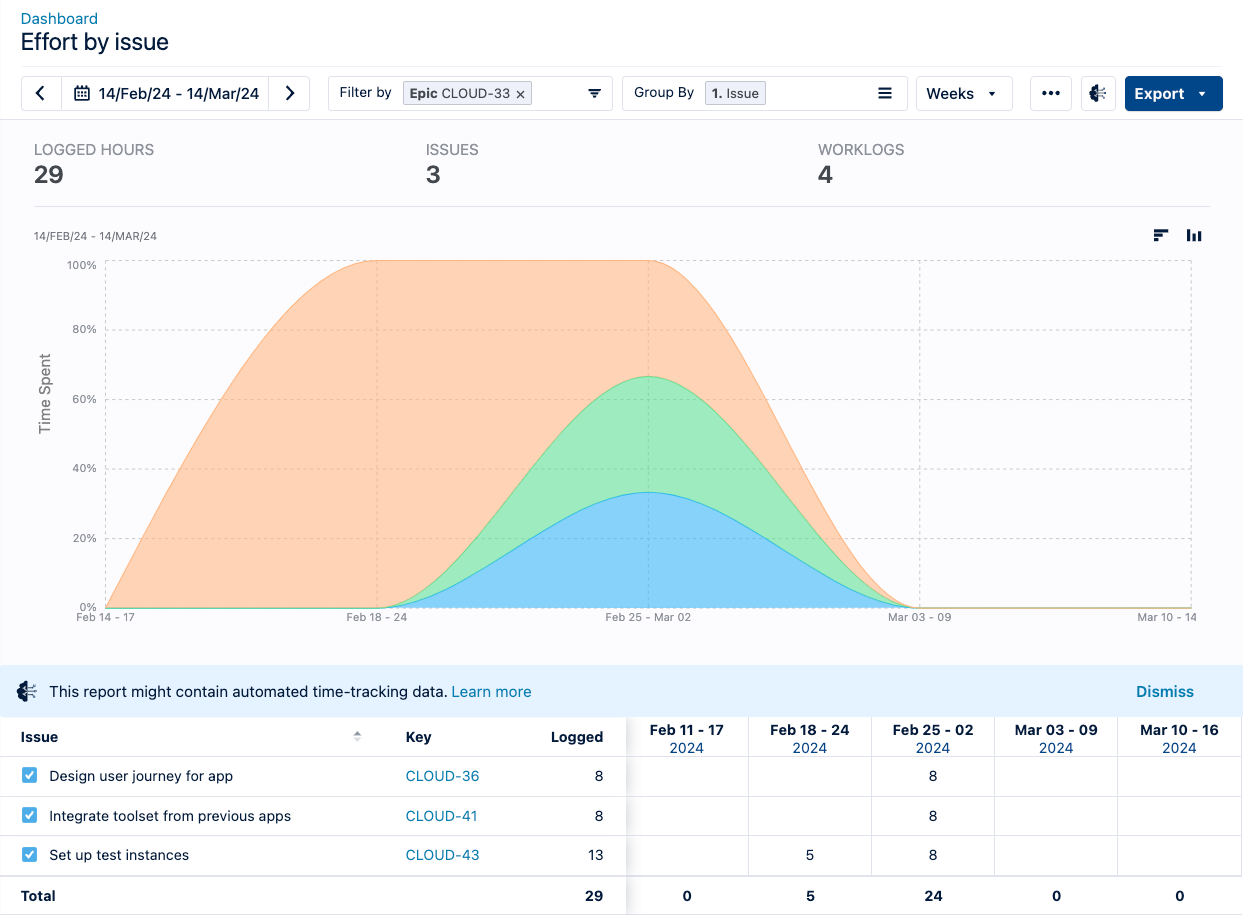
In the Tempo app, navigate to Reports.
Open the Dashboard tab. Depending on how much data has been generated, you can view information from different time periods, filter the presented information, and view various types of charts.
Hover over the chart for more information.
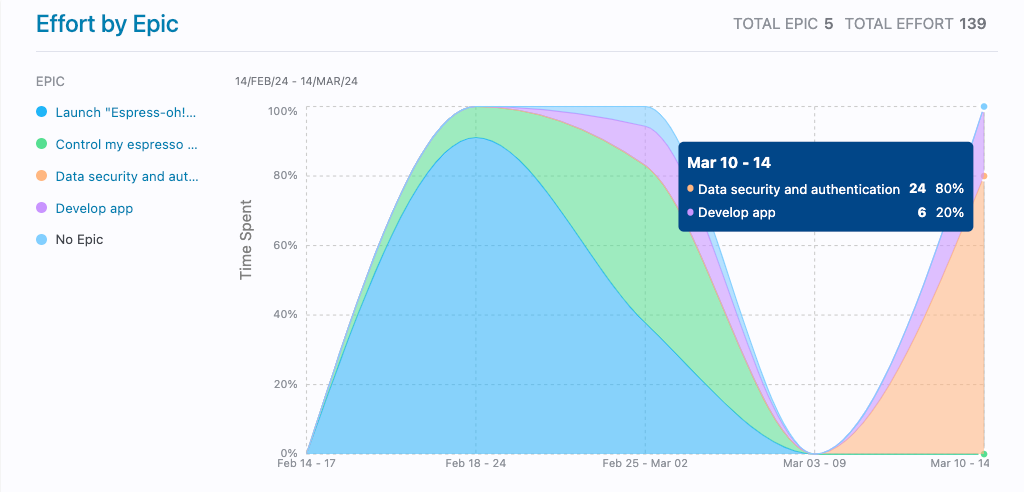
Control which epics are displayed in the charts.
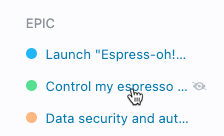
Select an epic and drill-down for more detailed information.
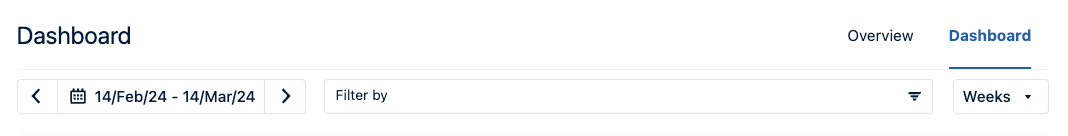
Change the Time Period
You can use the arrows to navigate to different periods; however, planned time in the future is not included in the charts.
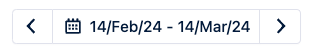
Click on the date range to choose a specific range or to change the period manually.
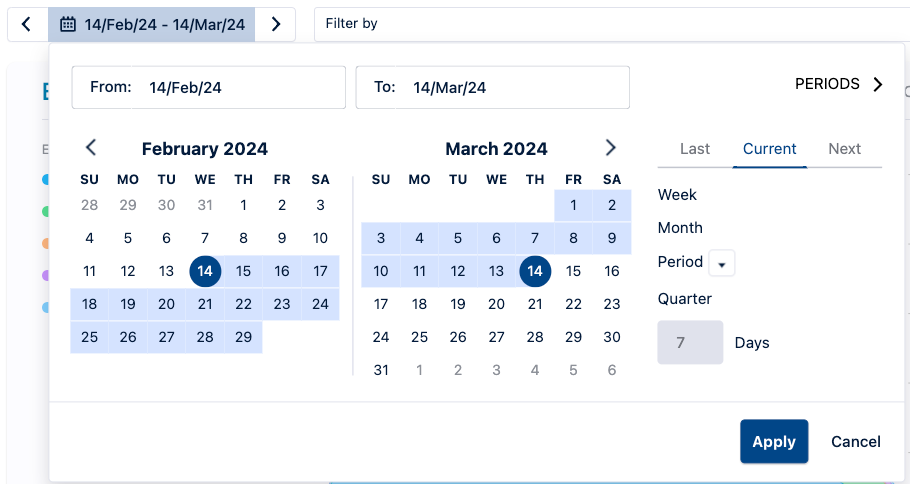
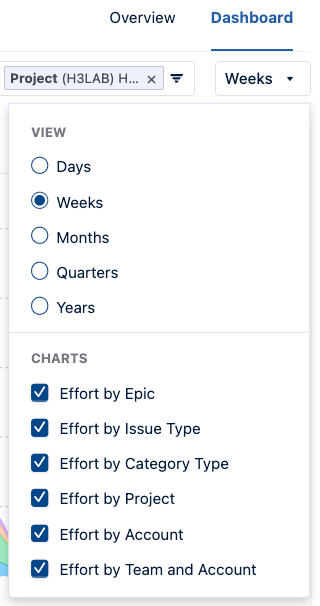
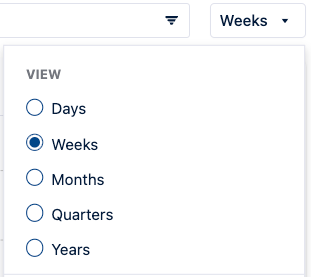
You can also change the granularity of the charts using the View menu.
Filter Charts
The Filter by field shows which filters are applied.
In a report, click the Filter by box to display a list of filter options.
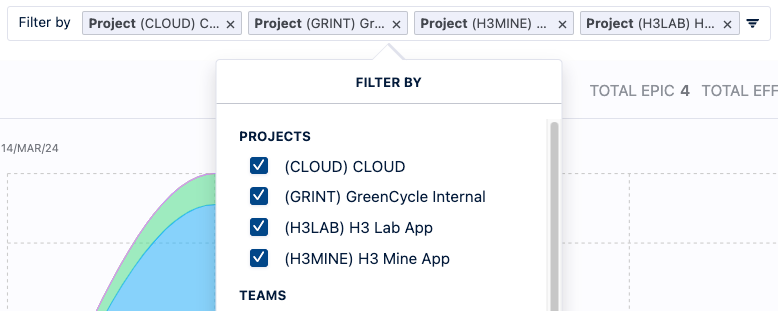
If you want to select a Jira Filter (JQL), scroll down to the bottom of the list.
Select the data you want to include.
Use the search box to search for projects, teams, accounts, etc. To add a filter, select the checkbox and click Apply & Search. To remove a filter, clear the checkbox or click the x beside its name in the Filter by field.
If you filter by Issues, you can also choose to include sub-tasks.
Click Back to return to the list of filters.
Control which Charts are Visible
Open the View menu and select the charts you want on the Dashboard.